Excel has three PercentRank() functions to give you the percent ranking of a value in a list of numbers. It’s different from the Excel rankings we’ve discussed before, because this is a percentage or percentile ranking
Let’s start with a simple example. There’s a list of values from 1 to 29 on the left. Column D is the PercentRank.Inc() formula measuring some test values against the list.
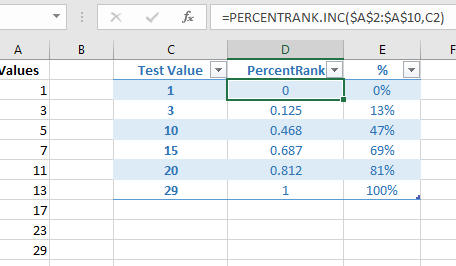
PercentRank.Inc() gives you the results that are commonly given for standardized tests. When you hear about the ’60th percentile’ etc, it’s a PercentRank() value.
The PercentRank() results in Column D are values from 0 to 1 which can be changed to a percentage, as in Column E.
Test Value 1 returns Zero because it’s the lowest value on the list.
Test Value 15 returns 69% because there’s more values below it than above. It’s said to be in the 60th percentile (ie above 60%).
Test Value 29 returns 100%, obviously.
Notice that the test value does NOT need to be in the values list – tests 10, 15 and 20 aren’t in Column A but still return a result. Excel figures out a position based on the available values.
Syntax
The syntax for the PERCENTRANK functions in Microsoft Excel is:
PERCENTRANK( List, X, Significant Digits )
List: A range of cells from which you return the rank.
X: The value you want to find the rank for.
Significant Digits: Optional. The number of significant digits in the result. Default is 3 significant digits.
There are three PercentRank() functions in modern Excel. Like many other Excel functions there’s an ‘old’ or deprecated function plus newer functions with slightly different naming.
PercentRank() is the original function. It still works in Excel but for future compatibility you’re better using the new versions. All three functions use the same arguments.
PercentRank.INC()
Ranks the values as a percentage, INcluding the first and last (highest/lowest) values in the list.
PercentRank.Inc() Is the same as the old PercentRank() function.
PercentRank.EXC()
Ranks the values as a percentage, EXcluding the first and last (highest/lowest) values in the list.
You can see the difference between the two functions in the example below.
Example
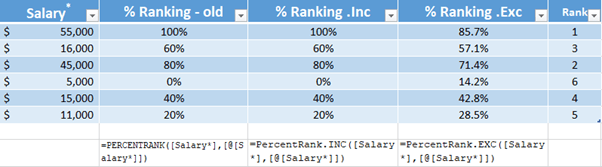
Microsoft suggest the PercentRank() can be used to compare salaries, so that’s what we’ll do. Another possibility is ranking student scores within a class or grade.
Here’s an example with the old and both newer functions plus a plain Rank() for comparison. We’ve made the PercentRank cells into percentages because that’s the way they are usually displayed.