Excel is getting a clever new way to quickly analyse your worksheets and pull out useful ideas or insights to quickly make PivotTables, PivotCharts and Charts.
It’s now available in Excel 365 for Windows and Mac, Insiders and will eventually make it to public releases. It’s now called ‘Ideas’, previously known as ‘Insights’ (a more accurate and appropriate term).
Ideas will send your worksheet to Microsoft’s servers which replies with analysis, suggested formulas, Charts and PivotCharts. It’s a quick way to take a long list or Excel Table and get some insights into trends, patterns and outliers (high or low).
Faster PivotTables and PivotCharts
Microsoft is pushing the natural language question part of Ideas but we’ve discovered the best use is making PivotTables and PivotCharts. Ideas presents a list of possible Pivot… additions, choose one that suits or is closest to your need, then amend it. It’s much faster than making a PivotTable from scratch.
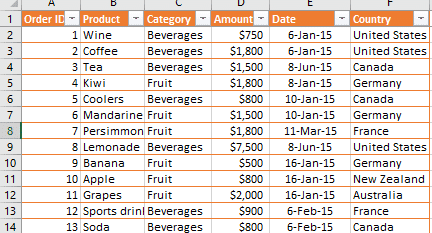
We’ve all faced tables like this one with over 50 rows. This table will be familiar to readers of our ebook PivotTables and PivotCharts from Scratch with its sample workbooks.
Click in a list or table, click on Home | Ideas. Wait while Microsoft’s AI cloud systems do their thing.
The Ideas pane shows a list of suggestions like a simple PivotTable with grand totals.
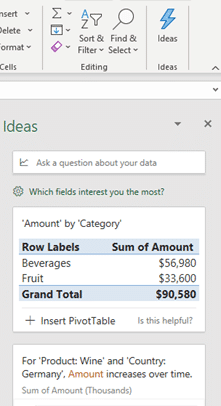
Scroll down to see many more ideas like increase/decrease over time or highest combined values.

Or see outlier values that are well outside the rest.

Ideas is also supposed to show suggested formulas but we could not make any appear in our tests.
If the data changes, click Ideas again and new analysis will appear.
But wait … there’s more …
The Ideas pane only shows the first few results, look for the little ‘Show all … results’ link at the bottom.

Which fields interest you the most?
The link, ‘Which fields interest you the most?’ is a cutesy and somewhat misleading name for some tweaks available to help Ideas.

It’s really a list of the fields available with the option to select/deselect ones that aren’t relevant.
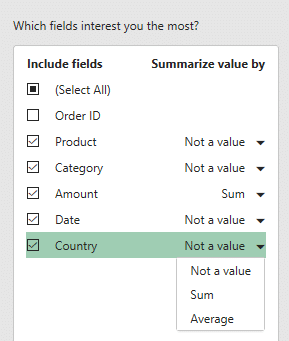
It also lets you specify if a field is a number value or not. If a number, does Ideas SUM() or AVERAGE() it.
Despite the title, there’s no way to rank fields in order of interest.
Ask questions
The part of Ideas that Microsoft is proudest of is the ability to type in questions directly. They call this ‘natural language’ questioning.
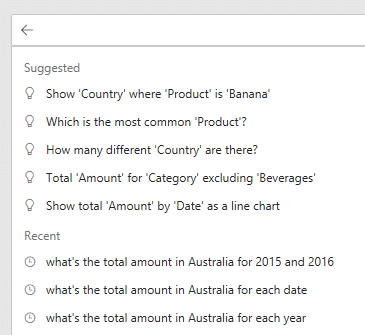
Excel nerds will have a lot of fun with this feature, seeing what questions Ideas will understand correctly or not.

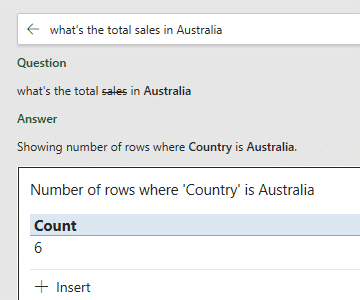
You need to stick to the field names otherwise Ideas doesn’t know what you’re talking about. This question doesn’t work because it mentions ‘sales’ not the column heading ‘amount’.
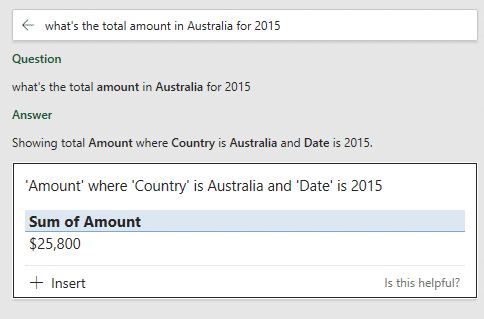
Change to a matching field name and Ideas works nicely. And you can add conditions.
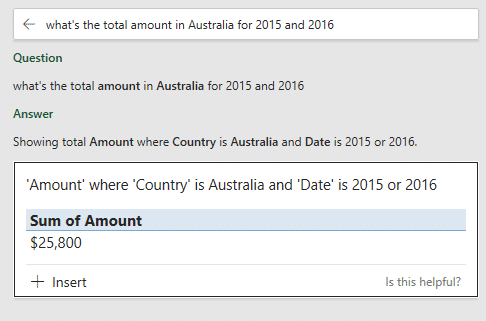
OR conditions will also work
Insert PivotChart
Click on Insert PivotChart to make a new sheet all ready to use.

It’s a normal PivotTable and PivotChart that you can edit and redesign just like any other. The PivotChart is linked to the original data as you’d expect.
Insert Chart
A basic chart can also be added, though it’s currently dumped on top of the original data.

Are Ideas a good idea?
Privacy concerns aside, Ideas is very useful and we look forward to it becoming widely available.
It should make simple data analysis a lot faster and more reliable.
Faster because it speeds up choosing what data should go into Charts and PivotCharts. The ‘headline’ results are immediately obvious.
More reliable because data outliers are detected and trends displayed that might otherwise be overlooked.
Natural Language questions works well but still needs some basic knowledge of queries to make the best of it.
If anything, Ideas is a bit too clever. There’s a focus on Charts and PivotTables/PivotCharts over more basic but important analysis.
Detecting outliers is an important part of Ideas and should get more prominence.
Ideas should include things like Average, Count, Minimum, Maximum and other simple statistics. Yes, some are already on the Excel status bar but should appear in Ideas, if only for the sake of completeness. Perhaps as a summary table?
Remember that this is a cloud service and the worksheet is sent to Microsoft for analysis. That could be a problem for some organizations with confidentiality and customer data limitations.