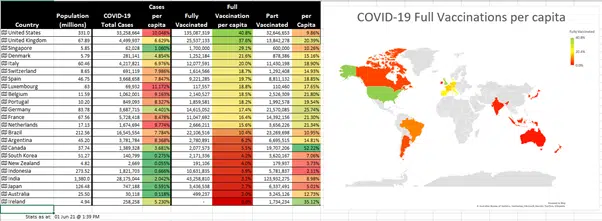
We have a new COVID-19 statistics workbook with a new automatically updating Excel spreadsheet that shows the latest cases and vaccination rates by country and region. All our Office Watch readers can get the entire workbook today.

We’ve made this workbook as a practical and timely example of some important recent Excel features and how they can be used. It’s available now for Office Watchers (anyone who gets our free newsletters like Office Watch).
The media coverage often deals with raw numbers without adjusting for population. So we opened up Excel 365 and made use of its Geography data type plus Get & Transform and Map Charts.
Add more countries to the bottom of the table and the map will update automatically. All the columns are sortable from the pull-down Filter buttons on each heading.
COVID-19 by Region or the whole World
New in this workbook is a breakdown by Region plus World.

Add more countries
To include more countries, type a country in the first column of empty row below the main table.

Make sure the country name is an exact match for the name in the Data list. For example, it’s ‘Netherlands’ not The Netherlands or Holland.
Press Enter and Excel will fill in the other cells, extend the table and include the new results in the conditional coloring.

There’s a way to change the names used in the data list see ‘Under the Hood’.
Data source
COVID-19 stats come from OurWorldinData which seems respected and is updated regularly.
It’s imported, converted and tweaked using ‘Get & Transform’ and the awesome but complex PowerQuery. See Under the Hood’.
Don’t touch the tables under the ‘Data’ tabs. Any changes will be overwritten next time the query is updated.
Reading the worksheet
Some things to keep in mind reading the COVID-19 worksheet.
We chose the % display because many of the published figures for past pandemics come in that form and it’s the best way to compare countries or regions. There are other ways to ‘slice and dice’ the same calculations, e.g. ‘Cases per million’.
Read the statistics with care. This is an ongoing situation, and the stats vary in reliability.
The official Chinese vaccination statistics are incomplete and total cases reported are improbably low. India’s COVID-19 case rate also seems low.
Testing availability impacts the count of COVID-19 cases. Where there’s not enough testing kits available, the cases numbers won’t show the full extent of the disease.
The cause of death might not be accurately recorded as COVID-19 or the government could be hiding the real statistics.
Health reporting systems across the globe aren’t always fast nor accurate. Even major countries like the UK have had trouble marshalling daily updates from across the country.
The data table we’re linking to has its own ‘per million’ values which we’re using in the workbook. They seem to be using different population figures than Excel’s Geography data type.
Get the workbook
The entire Excel 365 workbook is available now for Office Watchers (who have subscribed to any of our free newsletters) Office Watch, Office for Mere Mortals or Office Watch for Apple.
Download
Download the COVID-19 per country/per person workbook from the Exclusive Downloads links is in each issue of Office Watch, Office for Mere Mortals or Office Watch for Apple.
Compatibility
The main workbook download only works with Excel 365 for Windows. That’s not our choice, it’s Microsoft.
Three key features are only available together in the Windows release of Excel 365; Geography data type, Get & Transform/Power Query and Xlookup()
Get & Transform / Power Query is a major omission from Excel for Mac.
How to use
Open in Excel 365 for Windows.
As usual the ‘External Content’ warning appears because of the Get & Transform link to a data source. Click Enable Content to proceed.

Wait a few moments while the link to the COVID-19 stats are updated, the external data source is fairly large (15MB) so it might take a little time to load.
Refresh data
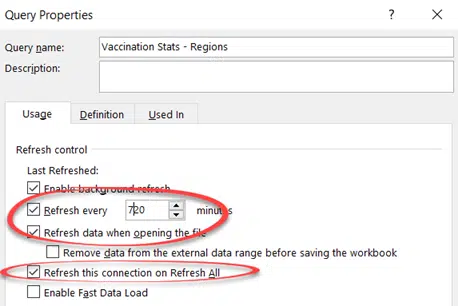
We’ve set the COVID-19 data to refresh automatically when the workbook is opened and again twice each day. See Data | Queries and Connections | Refresh All | Connection Properties.

Update the COVID-19 data at any time from Data | Refresh All or Ctrl + Alt + F5.
See when the COVID-19 data was last refreshed below the table. It appears in local time for that computer.

It’s the time that Excel last grabbed data from the web page, not the time of the most recent update of that web table.
Showing the query update date and time is one of those things you’d think that Microsoft made easy but is really obscure and indirect. See ‘Under the Hood’.
More info
Tips and help for COVID-19 Vaccination Stats download in Excel has a lot more details on how the workbook operates and what you can do to update it.