A new Excel add-in converts an Excel 365 worksheet into a Visio diagram. You don’t need to buy Visio to use the Microsoft Visio Data Visualizer in its simple form, just Excel 365 for Windows/Mac or Online.
It’s an interesting tool and worth checking out if you make diagrams or flowcharts. The add-in inserts example worksheets that you can use as templates for your own needs. An Org Chart is made from a table like this:
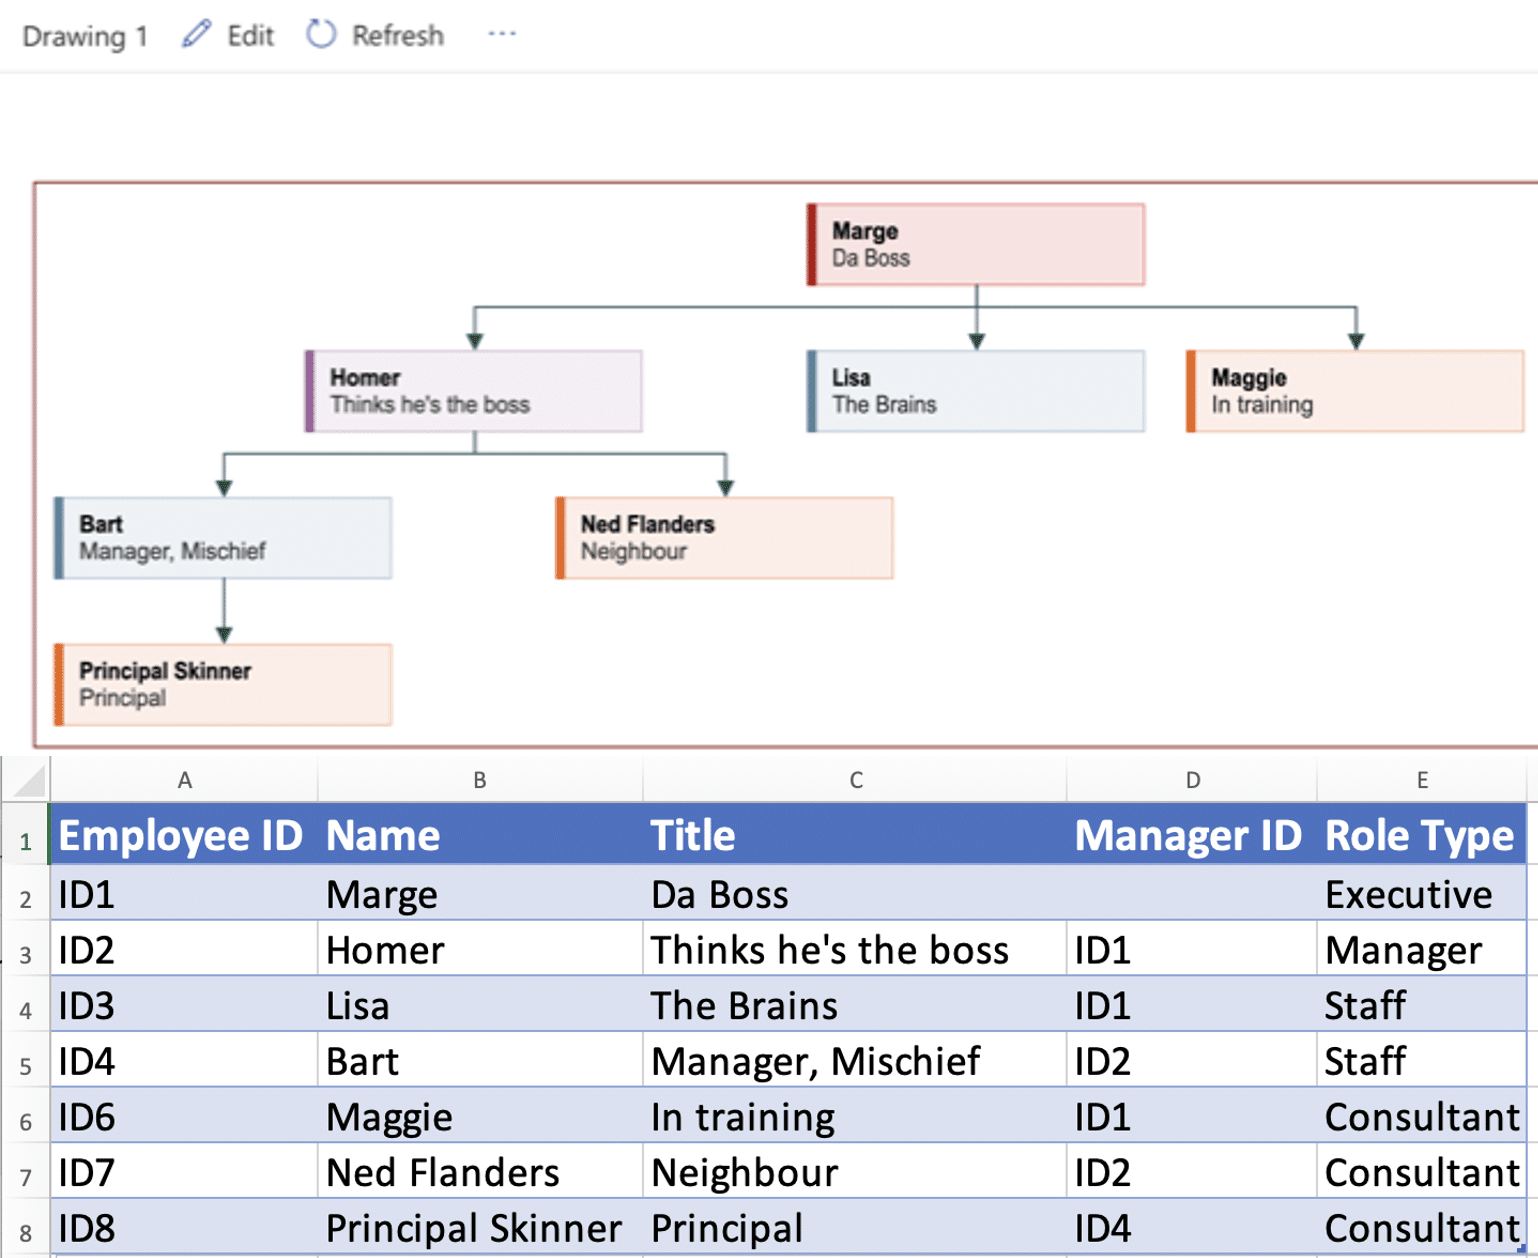
Or a simple flowchart from a worksheet in just a few minutes. We’ll go through this chart in more detail later in this article.

Change the diagram from the linked worksheet. Change label, add more rows etc and the diagram changes.

Data Visualizer is an alternative to the diagram options already in Office which can be quite annoying and limited.
On the other hand, without an expensive Visio licence, the Data Visualizer diagrams can’t be customized or edited. The color schemes are fixed.
Install
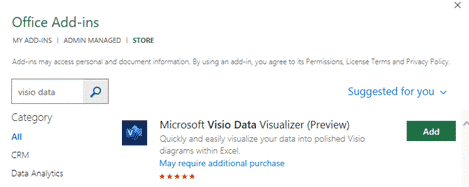
In Excel 365 for Windows, Mac or Online go to the Insert | Office Add-ins and search for ‘Visio Data’. Add ‘Microsoft Visio Data Visualiser’.
Tip: do this from a blank worksheet because the add-in will automatically insert into the current workbook.
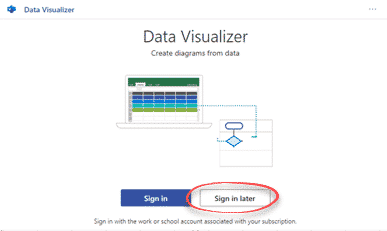
After it’s installed, the addin appears in the current worksheet. If you have an appropriate Visio licence, choose ‘Sign In’ otherwise ‘Sign in later’ for most people.
First time with Visio Data Visualizer
Insert a Data Visualizer into a worksheet from Insert | My Addins.
You could try converting an existing worksheet into a diagram but the worksheet has to be in a specific format. It’s a lot easier to start from one of the supplied examples.
Basic Flowcharts
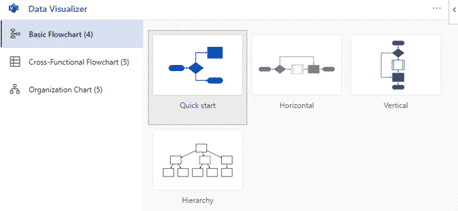
Cross-Functional Flowchart

Organization Chart

Making your own diagrams
Once you’ve chosen your starting diagram, check out the worksheet. This is where you’ll change the supplied example into something you’ll use. Each worksheet is different depending on the selected template.
Some parts of the worksheet are common to all. Let’s look at the Basic Flowchart worksheet and diagram that we presented near the start of this article.
Each element has a Process Step ID which is like old-fashioned coding line numbers that a BASIC programmer might remember. The defaults are in 100 increments so you can easily insert steps without renumbering, like we have with a new step P250.

Next Step ID tells the add-in where to draw links between steps.
Shape Type is a pull-down list of available shapes/symbols for the diagram.
Some shapes need a Connector Label, e.g. Decision needs labels for Yes/No, Left/Right etc.
Process Step Description is the label inside the Shape.
Alt Text can be added to make the Shapes more accessible.
The sample worksheet is just the starting point. Add more rows, change Shape Types, switch them around … go crazy!
The add-in will show any errors like inconsistent Next Step ID’s.
Click the Refresh button to see a revised diagram. We found that Refresh sometimes didn’t work and would just sit there doing “SFA”. The fix is to close the workbook and reopen it. That makes the Visualiser forget whatever nervy it was having and do its job <sigh>.
Extend the worksheet
In the real world, you can extend the worksheet to add more columns relevant, things like cost, location, people etc. These columns don’t change the Visio diagram but let you integrate the worksheet into broader analysis. Just for fun, we’ve added two columns to the original worksheet.

Editing
If you don’t have a separate full Visio licence (expensive) the Edit button doesn’t work.

Without a Visio licence, you’re stuck with the original color scheme and no other customizations allowed.
Bottom line: the only diagram changes possible are from the source worksheet, unless you can access full Visio.
Give it a try!
Our best advice is to give the Visio Data Visualizer a try. Open up a sample worksheet or two and see how it works.
The Office flowchart tool has always been annoying because the arrows between each step aren’t linked (i.e. move a shape and the arrows have to be moved individually).
The Data Visualizer is an interesting alternative.
According to Microsoft, Visio Data Visualizer is available in Excel 365, 2021 and 2019 for Windows or Mac plus Excel Online with a Microsoft 365 work or school plan. See Visio Online is available more (paying) customers
Two ways to view a Visio file free
Visio can now export to Word