Excel has a huge range of charts available and endless ways to customize them, but after working to get it just right, you don’t want to have to go through the whole process again next time you want to make a similar chart. Fortunately, you don’t have to because Excel allows you to save your chart as a template to use again whenever you need it.
To save your template, simply right-click on the completed chart and select Save as Template.

Then just give the template a name that will enable you to identify it later, and save in the suggested location.
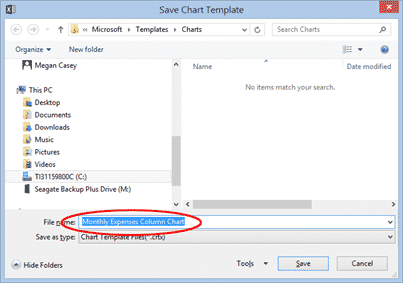
For Excel to quickly find the template save it to the default location and leave it there. When you later come to use your template to create another chart, only templates saved in the default folder will appear as available for selection.
However, there’s nothing stopping you saving a Chart Template .ctrx file to any folder.
Not all charts can be templates
Sometimes the ‘Save as Template…’ option is greyed out with no explanation.
Newer chart types, added with Excel 365 cannot be saved as templates. This limitation is true for all the new chart types released in Office 2016/365 like Waterfall, Histogram, Treemap, etc.
Amazingly, these charts were added to Excel without including template support. Microsoft considers templates an ‘extra’ that they’ll consider adding if there’s enough customer interest. Despite the passing of several years, this hasn’t happened.
Using the Saved Template
To make a new chart using your saved template, simply highlight the data that you want to chart, go to the Insert tab, then click either Recommended Charts or the arrow at the bottom right of the Charts group.

In the dialog that opens, click on the All Charts tab and then select Templates on the left.

Then just select the template you want to use, and click OK to create your new chart.
Templates shows all the .ctrx files in the default location.
To select a template saved in another folder, click on Manage Templates then a folder on your computer or network.
Changing an Existing Chart to a Saved Template
You can apply a template to a chart you’ve already created.
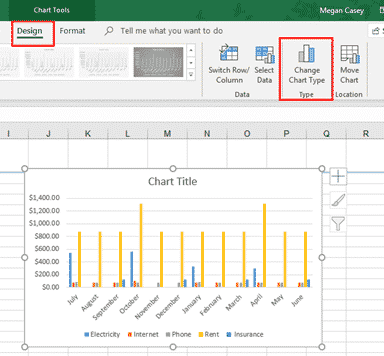
Say I have just made a column chart for a similar set of data, using Excel’s default column chart format, as I forgot that I had set up a template for this type of chart with slightly different features. So to apply the template to this chart, either:
- Right-click on the chart and select Change Chart Type.

OR
- Select the chart and click Change Chart Type on the Design tab.
Then just go to All Charts | Templates and select the appropriate template, just as we did above.
What Elements Are in the Template?
You may be surprised when you create a chart from a template that not everything in the original chart appears in your new chart. Notably, the text in your title and axis labels and legends will not be what you saved in your template. Typically, a chart template contains:
- The chart type (bar chart, column chart, pie chart, etc.)
- Which elements are included, and where they are located (such as titles, labels and legend).
- Aesthetic elements such as colors and fonts.
Anything else, such as the content of labels, titles, and legends, must come from the data you are making the chart from. Otherwise, these elements will be there in the same location as in the template, but containing only placeholder text, so you will have to edit the text to say what you want.
For example, let’s say I have a similar set of data, but the column headings are slightly different.
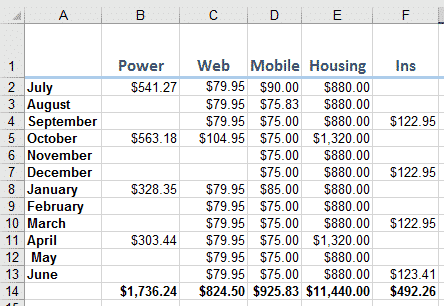
I now make a chart out of this data using my template, and it looks like this:

Note that the column colors are the same as those in our original chart, but the legend has different labels because our new data has slightly different names for the column headings and they’ve come from the data, not the template.
There are also placeholders for the chart title and axis labels, but we will have to click on these to edit this information, as this was not in the data we have used to make the chart.
Adding and Deleting Chart Templates
If you want to delete a template, or add a template that you have somewhere other than the default folder, simple go back into the Change Chart Type dialog by going back to Insert | Recommended Charts | All Charts | Templates. Then click the Manage Templates button at the bottom of the dialog box.

This will open Windows Explorer on the Charts folder, where you can drag a template in from another folder, or select a template and delete it.

Under the hood
What’s in the chart template .ctrx file?
No surprise, it’s just like other Office documents. It’s a ZIP file with XML and other files inside.

/Chart/Chart.xml has most of the template settings.
/Chart/Charts/ has the color and style details.