StockHistory() is an Excel function that can add historical stock price info, as well as currency exchange rates at monthly, weekly or daily intervals. Date and Closing Price plus optionally Open, High, Low and Volume. All ready to make a chart for stock price analysis.
Excel 365 has Stock and Currency data types but they are ‘limited’ to the current prices (Latest, Open, Close).
The Excel 365 function is one of the newer types of Dynamic Array formulas, that will spill into neighboring cells.
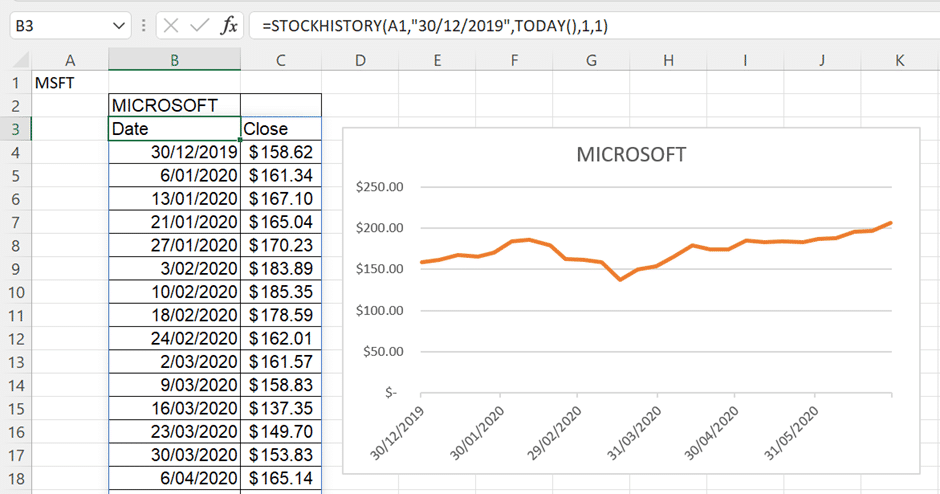
For example, here’s the stock history for Microsoft showing the weekly closing prices since the 30th of December 2019. The formula in cell B2 is:
=STOCKHISTORY(A1,"30/12/2019",TODAY(),1,1)
It fills the cells across and down. We’ve added the chart.
All the Stock History
By default, StockHistory only shows the date and closing price. Add a sixth and beyond parameters to see all the available data, Date, Close, Open, High, Low and Volume.

Exchange Rates too
Though it’s called ‘Stock’ History, the same function works for currency exchange rates. That’s because both stock and exchange rates come from the same data source.
Instead of a stock ‘ticker’ code, use the currency codes (USD, CAD, GBP, EUR, AUD etc) separated by a / or :
For example, the US Dollar to Ukraine currency rate:
=STOCKHISTORY("USD/UAH","30/12/2020",TODAY(),2,1)

Introducing STOCKHISTORY()
The STOCKHISTORY() function has a variety of different parameters, in its ‘simple’ form, it looks like this …
Syntax
=STOCKHISTORY(stock, start_date, [end_date], [interval], [headers], [property0], [property1], [property2], [property3], [property4], [property5])
Arguments
- Stock – this is the function that returns the historical price data corresponding to this value. You can either refer to a cell with the information or ticker symbol in double quotes such as “MSFT” or “USD/UAH” like we used above. Unlike the Stock/Currency data types, there’s no search function.
If you’re unsure what the ticker symbol is for the company and the right exchange … you can use Excel to search for it.
- Start_Date – you’ll need to wrap the start date in double quotes such as “01/01/22” or you can use a cell containing a serial date. If start date that was before stock was trading, then it’ll provide results from the oldest date that is available.
- End_Date – Optional. You’ll need to wrap the end date in double quotes or you can use a cell containing a date. If you do not include an end date, it’ll default to Start_Date (in other words, give a single days price). Use Today() to get results up to the latest available.
The function doesn’t provide intra-day result. The latest date will be the previous day’s close, usually it will not show today’s closing price until many hours after the market closes.
- Interval – Optional. Choose between daily (0), weekly (1), or monthly (2), default is daily.
- Headers – Optional. Choose between returning the data without any column headers (0), a show headers (1) or show headers and instrument identifiers (aka stock ticker code) (2), default is show headers.
- Property0 – Property5 – Optional. Control which columns appear and the order. Choose between date (0), Close (1), Open (2), High (3), Low (4), Volume (5). Only the indicated columns will be returned in the order that you specify, default is date and close.
If you need the very latest price, use the Stock/Currency linked data type instead, using the .Price value.
Excel’s Stock / Currency data (kinda, sorta) gets auto-refresh
The single cell trick to get an Excel stock or currency rate
Put the latest Stock and Fund prices in Excel workbooks
Degree Celsius ℃ symbol in Word, Excel, PowerPoint and Outlook
Four ways to split date into day month year in Excel