Pivotby() is a new and easy way to make PivotTables in Excel. It’s one of two new ‘aggregation functions’ but we prefer to call them fast summary powers. We’ll dig into the detail of what PivotBy() can do.
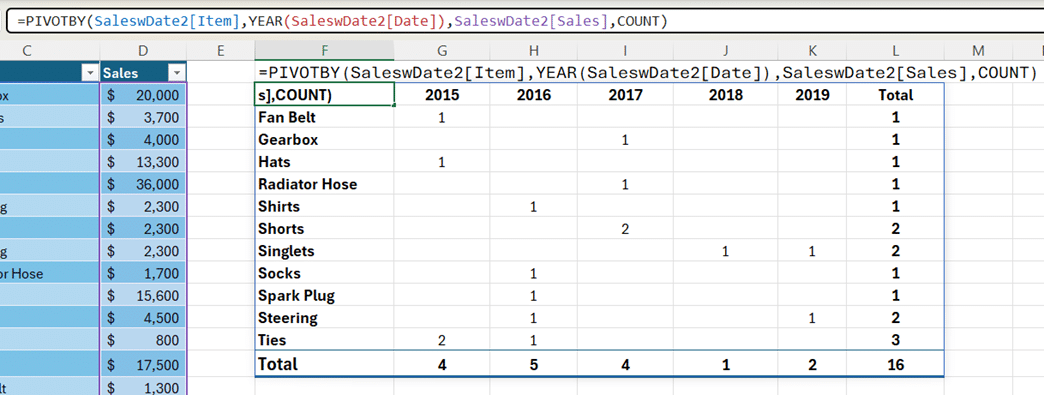
Excel has been able to group or combine data for many years but now all you need is a single function to convert a data list or table into a PivotTable like this:

=PIVOTBY(SaleswDate2[Item],YEAR(SaleswDate2[Date]),SaleswDate2[Sales],COUNT)PivotBy is closely related to another new Excel function, Groupby.
PivotBy()
PivotBy() lets you make a PivotTable with just three parameters.
- What to group e.g Category
- What to group by e.g. Sales Value
- How to combine (SUM, Count, Average, Max, Min and many more).
There are other options, the full syntax is:
PIVOTBY(row_fields,col_fields,values,function,[field_headers],[row_total_depth],[row_sort_order],[col_total_depth],[col_sort_order],[filter_array])
Beware!
A few things to watch out for.
PivotBy() and Groupby() return a dynamic arrays so make sure you leave room below and to the right to avoid #SPILL errors.
A manually filtered table is reflected in the Pivotby() and GroupBy() results. That could be what you want but be aware that a change in the source data filtering will affect the Groupby() summary. If the source is on another sheet, the filtering might go unnoticed.
Many Calculation options
There are many formula options to summarize data in different ways and Microsoft has even added a new function to help.
Here’s the (almost) full list of available summary functions.
- SUM
- PERCENTOF
- AVERAGE
- MEDIAN
- COUNT
- COUNTA
- MAX
- PRODUCT
- ARRAYTOTEXT
- CONCAT
- STDEV.S
- STDEV.P
- VAR.S
- VAR.P
- MODE.SNGL
All those options are existing Excel functions except one, PERCENTOF. More on that below.
Add any Lambda() function to PivotBy
We said ‘almost all’ because in addition to the list of in-built functions, you can choose any compatible Lambda() function to process the data.
Here’s a CountStars() function which returns a * for each item instead of a total from Count().
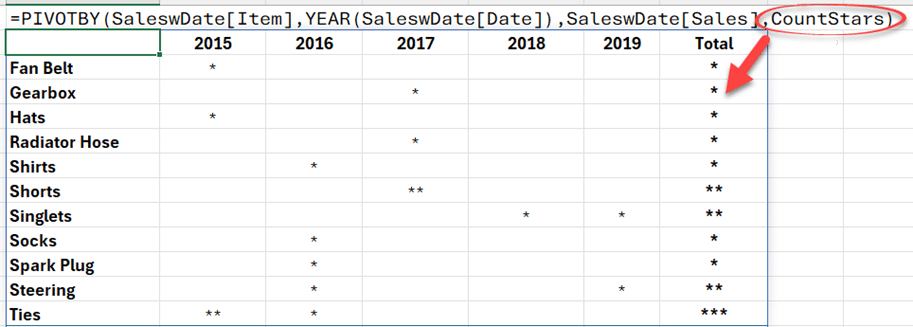
The Lambda function is
LAMBDA(x,REPT("*", COUNT(x)))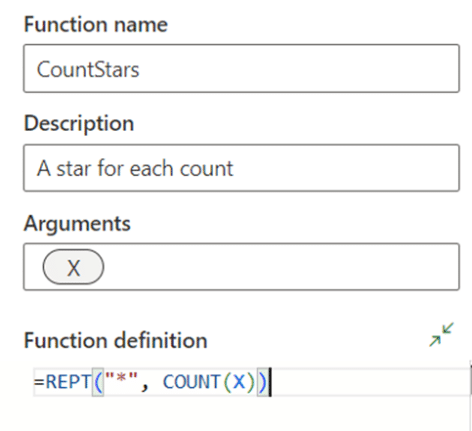
Can we say again how much we LOVE Excel Labs!!!!
PERCENTOF
Percentof() is a new and very simple function that gives the percentage that a data subset is of complete data set. It’s the same as writing =SUM(data_subset)/SUM(data_all)
Percentof() can be used on its own though it’s been added to Excel so PivotBy() and GroupBy() can have a simple and obvious percentage summary. Nice touch.
Sorting
[row_sort_order] and [col_sort_order] parameterslets you choose the row/column to sort by; 1, 2, 3 in ascending order.
Use negative numbers for descending order -1, -2 etc.
Headings
Choose whether to include column headings or not using the fourth [field_headers] parameter.
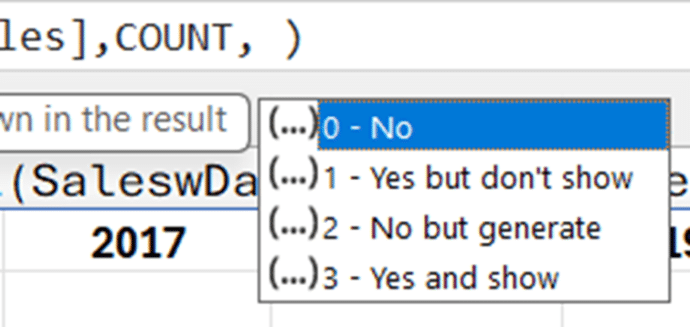
0 – No headings.
1 – Yes but don’t show the headings
2 – No headings but generate them
3 – Show headings.
Totals
[row_total_depth] and [col_total_depth] are good options for showing totals and subtotals
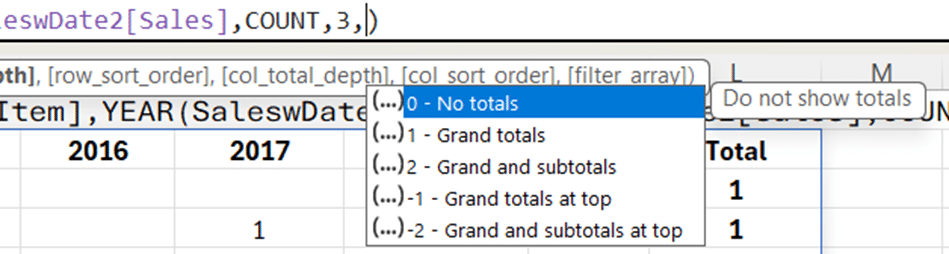
0 – no totals
1 – show Grand totals
2 – show Grand and sub-totals
-1 – show at top the Grand totals
-2 – show at top the Grand and subtotals
Choose your rows
Select which rows to include in the grouping using the last parameter filter_array] An array of Boolean (True/False) values. One for each row in the table data and the array length has to be the same as the number of rows.
Who gets it?
Groupby() and Pivotby() should now be available to all Beta Insiders of Excel 365 for Windows and Mac. A lot of the Microsoft documentation implies that both functions are available in public releases but they’ve yet to appear in any ‘Current Channel’ version we’ve seen.