Adding a moving average line to an Excel Chart is very easy, just a few clicks, with many options. Any chart with a series of values over time will benefit from a trendline like a moving average.
What is a moving average?
An average / mean is a single value representing a list of numbers. Add all the values together and divide by the number of values. In statistics it’s one of the measures of central tendency.
A moving average is great to see trends over time. For each value, take an average of the last, say, 2 values then do that for all the values. The result is a two period moving average.
Example: a series 1, 2, 3, 4, 1 the moving averages are 3, 5,7 and 5.
Excel Moving averages
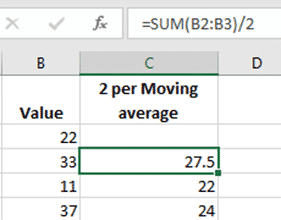
Calculating a moving average is quite simple in Excel. Create a SUM() for the number of values you want (two in this case) and divide by the number of values then copy that formula down the column. Or use the AVERAGE() function.
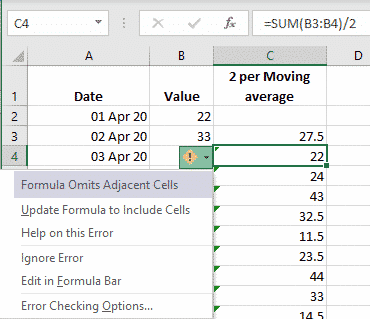
Excel will show an error warning ‘Formula Omits Adjacent Cells’ which you can clear via ‘Ignore Error’.
However you do NOT have to do that calculation for an Excel Chart. Excel can add trendlines including Moving Averages into a chart without needing to fill any cells.
Make a Chart
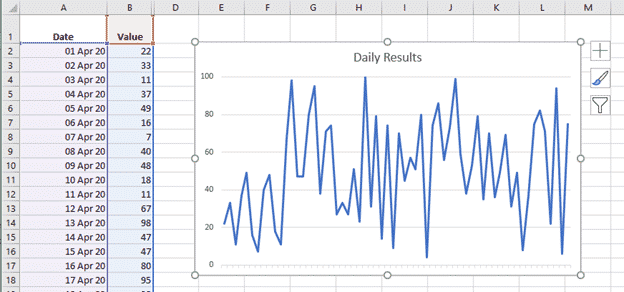
Add a chart with the date/value pairs in the usual way.
Add a Trendline
Choose the Chart Elements “ + “ button and select ‘Trendline’. That adds a default trendline which we’ve colored orange so it stands out.

Click on the Trendline then, from the Format Trendline side pane, choose Trendline Options.

You can see that Microsoft’s default is a simple linear trendline or ‘straight line’. There are other trendline options: Exponential, Logarithmic, Polynomial, Power and the one we’re focusing on Moving Average.
Add Moving Average line in Excel Chart
Choose ‘Moving Average’ and the trendline changes a lot. The default is a 2 period moving average, the same as the column calculation we did earlier.

We’ve changed the daily results line to a faded shade to make the trendline / moving average stand out.
For a smoother trendline, increase the moving average period setting. Here’s the 6 period moving average, compare that with the more jagged 2 period line above.

Excel Charts – give them a try
Excel charts – It’s all in the data
Saving an Excel Chart as a Template
Excel 2016 – Jan 2016 update – new chart and functions