Get Economic data or graphs from FRED (Federal Reserve Economic Data) to load into your Excel workbooks or PowerPoint slides.
From unemployment rates to the price of potato chips. FRED has 825,000 data sets for the USA and around the world.
Tip: search FRED for your country (Canada, United Kingdom, Australia etc) to see what data they have.
Download from FRED
Go to any FRED page to see a nice graph like this (we weren’t kidding about the price of potato chips!).
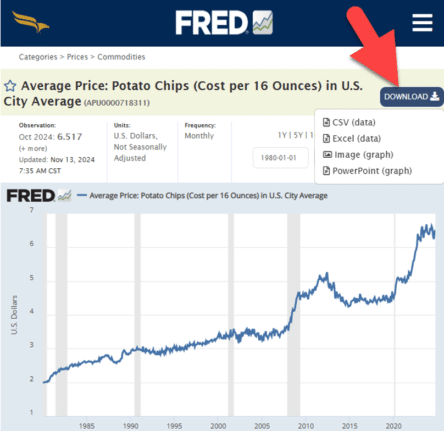
The download button has four options, two for data and two to download a graph.
Data: in CSV text format or Excel file (an old-fashioned .XLS file)
Graph: as a image (PNG file) or PowerPoint presentation.
FRED in Excel
The Excel download opens in a single sheet like this:
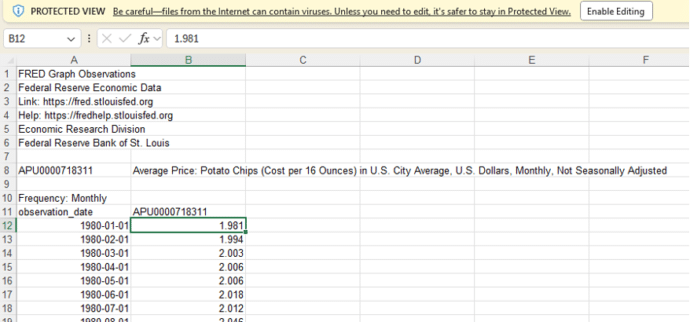
It’s best to File | Info | Convert into a modern .xlsx file which is safer and also smaller than the older format.
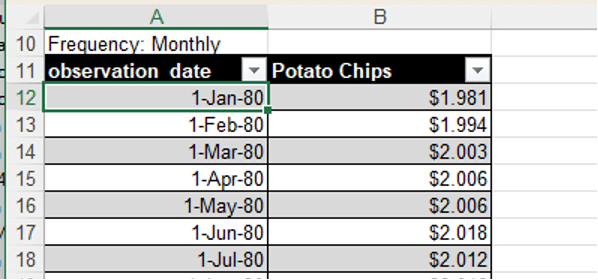
Format the data as a table and convert the dates from text into Excel date format (Home | Number | Date) and the values into Currency with three decimal places.
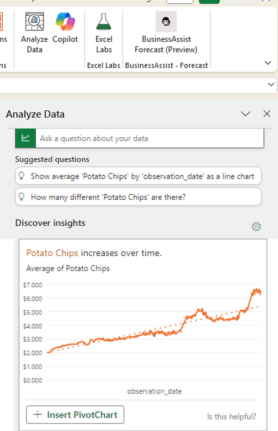
Now you can have nerdy fun making charts, PivotTables or let Excel do the work via Analyse Data or Copilot.
FRED graph in PowerPoint
FRED’s PowerPoint download uses the modern .pptx format. You get a single slide with an image of the chart.

Tip: it could be faster and easier to download the chart image only or take a screen-shot of the web chart, then insert that into a document, sheet, slide or email.