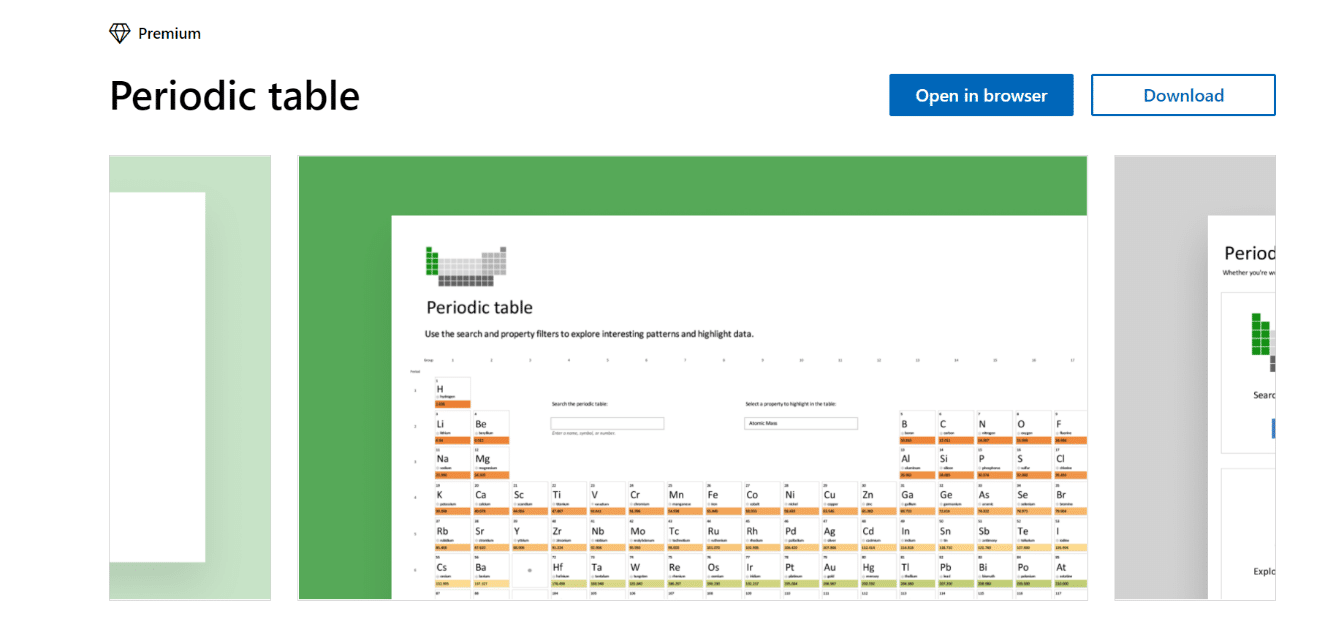
Excel and Wolfram have teamed up to produce a handy interactive Periodic Table Template, useful for those searching for an introduction to chemistry, or a handy guide for study.
The table lets you easily access information on elemental properties, chemical compounds, diagrams and more.
You can download or open the template in your browser here.
The Excel Periodic template is quite involved with many options we’ll explain below.
If you’re looking for something more straight-forward check out our list of Great Periodic Table in Office documents.
Explore data in the Periodic Table
Simply select the Periodic Table box or Periodic Table tab to interact with data in the periodic table.

Look up a name, number or symbol in the search box.

Here we have typed Magnesium and it has been highlighted on the table for our reference.

Use the drop-down box to change the property filters to highlight similarities and differences amongst data. Filters include:
- Atomic Mass
- Atomic Radius
- Block
- Boiling Point
- Covalent Radius
- Discovery year
- Electron affinity
- Electronegativity
- Group
- Human Abundance
- Melting Point
- Meteorite Abundance
- Ocean Abundance
- Period
- Solar Abundance
- Valence
- Van der Waals radius
Compare Elemental Properties
Simply select the Elements box or Elements tab to compare elemental properties.

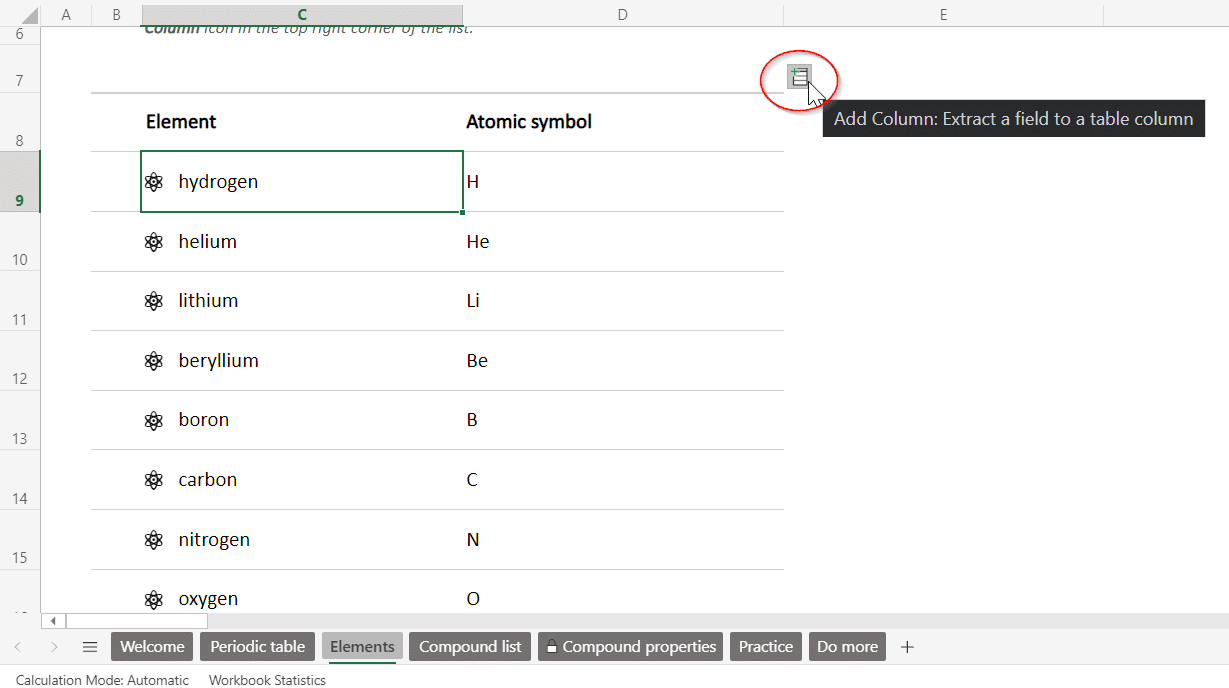
A list is provided with common elements and their atomic symbol.

Simply click on the icon next to each element (or select the cell and use Ctrl + Shift + F5) to view more data.

This will bring up the Wolfram Data card which will provide information on basic atomic properties, atomic size, chemical properties and more.
Otherwise, you can add more columns of information to easily compare data in one big table.
Simply select an element on the list and click on the Add column symbol in the top right-hand corner.

Fields that can be added to each table column include:
- Atomic mass
- Atomic number
- Atomic radius
- Atomic symbol
- Block
- Boiling point
- CAS number
- Covalent radius
- Crust abundance
- Density
- Discoverers
- Discovery country
- Discovery year
- Electrical conductivity
- Electron affinity
- Electronegativity
- Group
- Human abundance
- Image
- IUCr space group number
- Known isotopes
- Lattice angles
- Lattice constants
- Mass magnetic susceptibility
- Melting point
- Meteorite abundance
- Molar magnetic susceptibility
- Name
- Number of protons
- Ocean abundance
- Period
- Periodic table location
- Resistivity
- Solar abundance
- Stable isotopes
- Universe abundance
- Unstable isotopes
- Valence
- Van der Waals radius
- Volume magnetic susceptibility
- Wikipedia summary text
- Wolfram data type

Track Chemical Compounds
Simply select the Compound list box or Compound List tab to track chemical compounds.

A list is provided with common compounds and their formulas.
You can add your own favourite ones to the bottom of the list.

Simply click on the icon next to each compound (or select the cell and use Ctrl + Shift + F5) to view more data.
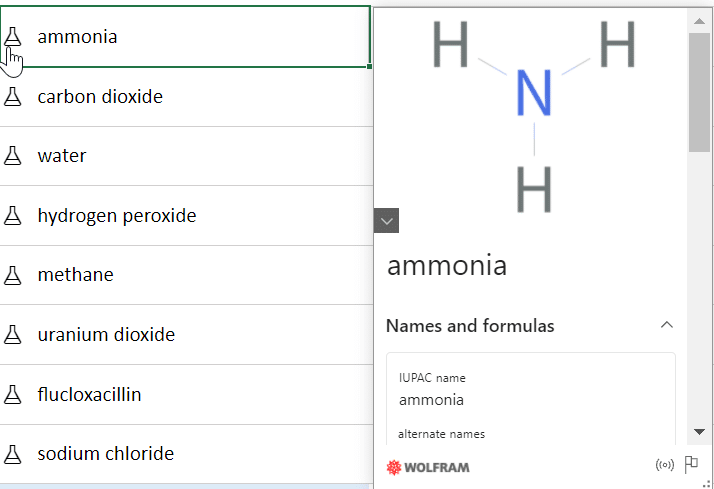
This will bring up the Wolfram Data card which will provide information on names and formulas, 3D structures, mass and charge and more.
Otherwise, you can add more columns of information to easily compare data in one big table.
Simply select an element on the list and click on the Add column symbol in the top right-hand corner.
Fields that can be added to each table column include:
- Atomic mass
- Atomic number
- Atomic radius
- Atomic symbol
- Block
- Boiling point
- CAS number
- Covalent radius
- Crust abundance
- Density
- Discoverers
- Discovery country
- Discovery year
- Electrical conductivity
- Electron affinity
- Electronegativity
- Group
- Half life
- Human abundance
- Image
- IUCr space group number
- Known isotopes
- Lattice angles
- Lattice constants
- Mass magnetic susceptibility
- Melting point
- Meteorite abundance
- Molar magnetic susceptibility
- Name
- Number of protons
- Ocean abundance
- Period
- Periodic table location
- Resistivity
- Solar abundance
- Stable isotopes
- Universe abundance
- Unstable isotopes
- Valence
- Van der Waals radius
- Volume magnetic susceptibility
- Wikipedia summary text
- Wolfram data type

Study Compound Properties
Simply select the Compound list box or Compound List tab to track chemical compounds.

Users can easily keep track of their favour chemical compounds and study compound properties in further detail.

Just use the drop-down arrow to select your chemical compound property, and Excel will autofill the correct data.
For example, if we choose sodium chloride, it will provide us with alternate names, formula, elements, periodic table properties and more. One could say that this is a more visually pleasing representation of each chemical property and would be useful if you’re not looking to immediately compare between compound properties.

Create your own practice test
Simply select the Practice box or Practice tab to show your understanding of basic periodic table and answer chemistry questions.
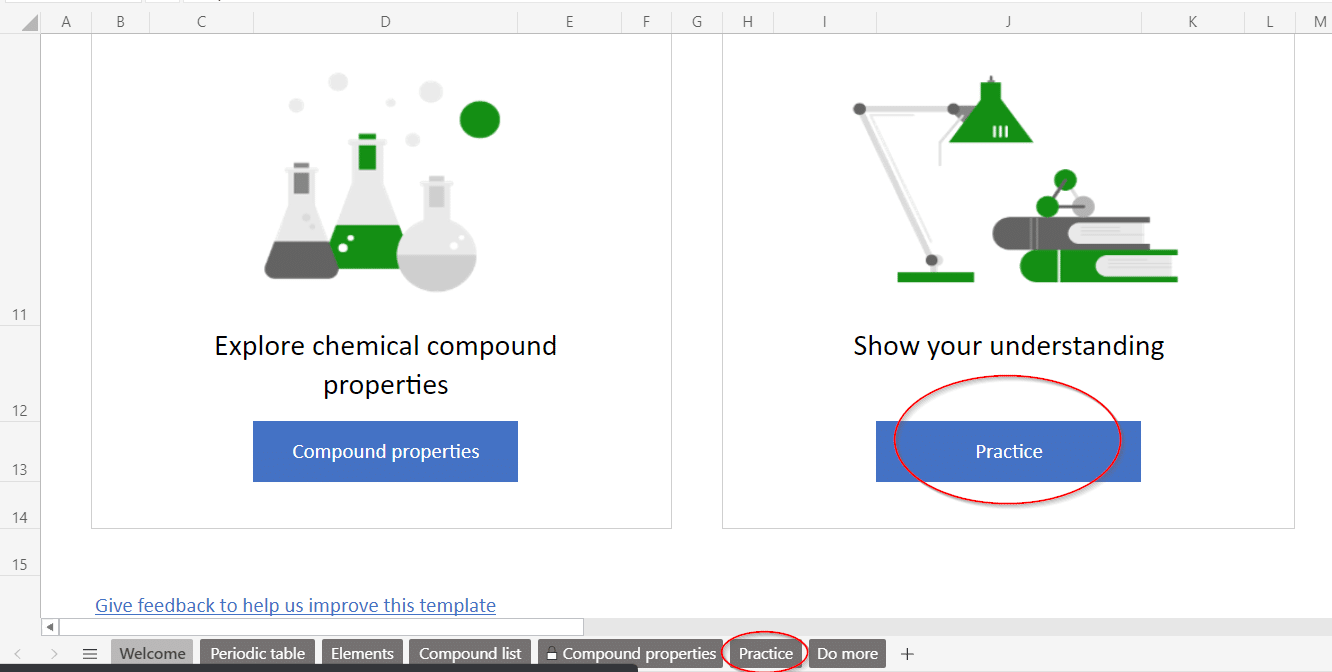
Studying for an upcoming exam? The practice tab might prove useful to help you test your understanding.

The only problem is that it doesn’t seem to have an interactive feature, unlike the Compound properties tab, if you wanted to change up the questions, you would need to do this manually yourself.
Great Periodic Table in Office documents.
Free and Clever US College Decision Helper with Excel
More linked data types coming to Excel 365
Inside Excel’s newer and better Linked Data Types