Get started and understand Microsoft’s Power BI using the free desktop app. Here’s how to setup Power BI and some of its nifty tricks to delve into and make sense of data. All without the hassle of a ‘free’ trial.
With plenty of buzzwords such as data-driven culture, business intelligence, analytics, metrics, KPI and our least favorite “data hero”, Microsoft Power BI (Business Intelligence) can seem like it’s way too complicated to bother with.
Put simply, Power BI takes tables or lists and converts them into charts and reports which are interactive. We’ll explain that below but here’s a sample of what’s possible.

Even better, Microsoft’s cloud systems can analyze and summarize the data to highlight the major trends and outliers – we’ll also show the basics in this article.
Microsoft wants people to get into Power BI via the free trial leading direct to a monthly fee. That serves Redmond’s purposes but not necessarily customers. Power BI desktop is a better way to get into the product. For some small businesses it might be all they need!
Download Power BI desktop
The free app is available from Microsoft for Windows 11, 10, 8.1 and 8 plus Server editions.
Starting Power BI desktop
Choose the Get data option, at left.

Then choose ‘Try a sample dataset’ or choose another option if you prefer.

The Financial Sample Excel workbook is also available as a separate download. Open it in Excel to see it’s merely a list of 700 transactions/rows. Nothing special or complicated. It’s PowerBI that does all the ‘heavy lifting’.

Power BI has a long, long list of data sources to choose from. We’ll stick with the Financial sample data.

Make a report
Now the fun begins. Making a report in Power BI, a combination of charts which are interactive. That means choosing an element in one chart will make the others change to a similar filter.
Start making a single chart, just choose two fields (e.g Sales and Country) and Power BI creates a simple bar chart.

Now we’ve added another chart showing Sales per Product. Not only that, but Power BI links the two charts so choosing a country bar (France) from the top chart automatically changes the bottom chart to show product sales for that country as compared to all countries.

Of course, the reverse is possible. Choose a product and the sales per country for that product will appear. We’ve also changed Sales by Country to a pie chart using the Visualizations pane at right.

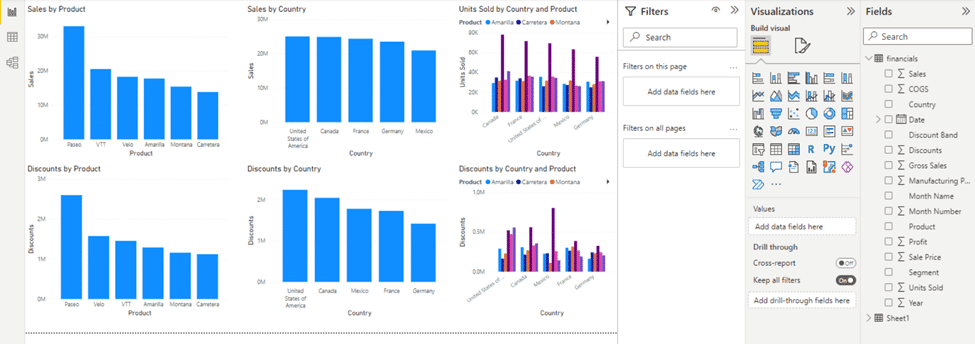
That kind of interactivity is possible in Excel but it’s a lot more complicated to setup. In Power BI, it’s amazingly simple. And it doesn’t just apply to dual charts. Here’s six charts on a single page, this time filtered by choosing a single product (Paseo). A video showing off the interactive features is at the start of this article.

Right-clicking on any chart shows some interesting options; Show as Table, Analyze and Summarize.
Analyze
Analyze is really clever, Microsoft’s systems look at the data to see what causes the values to change. This is just the first of many results that appear.

For this sample data you can quickly see which countries, products, months or even days most affect overall sales. In other words, finding outliers.
Summarize
Summarize creates a text version of the overall chart.

Show as Table
Show as Table is obvious, it presents a table of the source numbers with the chart.

Choosing a row in the table will filter the chart accordingly.
This example also shows that a tooltip appears when your mouse hovers over a chart element.
And there’s a lot more ….
We’ve just added a glimpse of what’s possible with Power BI desktop free, let alone the full paid version.
There’s a lot more available. Explore for yourself or check out the many Power BI resources available online.
Arrange your own data into an Excel workbook, then link it to Power BI desktop. Maybe you’ll uncover some secrets hiding in your business data?
But there’s also limitations …
Power BI is free and works with local Power BI data files (.pbix files). It can also use Power BI data stored in the cloud but that requires a Power BI licence aka Power BI Pro.
That’s important because some Power BI features require cloud access and the Pro version. For example the Power BI connections in Excel or PivotTables or PowerPoint for reports only work with Power BI saved in Microsoft’s cloud, not locally stored .pbix files.
Power BI Pro
Power BI Pro costs US$9.99 a month per user. There’s a free trial. Go to Microsoft’s Power BI site.
Microsoft wants people to get into Power BI via the free trial. We suggest using Power BI desktop as the entry point because it has a lot of good options to experiment and use without the time limit of a trial period.
PowerBI reports direct and live in PowerPoint
Make a PivotTable direct from PowerBI data
Quick Excel list sorting and filter buttons
Text to Excel Date conversion by adding Zero with Paste Special
Five ways to turn text into Excel dates
Smarter PivotTable recommendations coming to Excel