Australian data nerds rejoice! The first load of data from the 2021 Census has been released in a format ready for Excel. Here’s how to get it and look at the detailed statistics for yourself.
The Australian Bureau of Statistics has just released the first block of data from the 2021 count with more to follow (it’s a huge job) in October 2022. In Australia, a national census is conducted every five years.
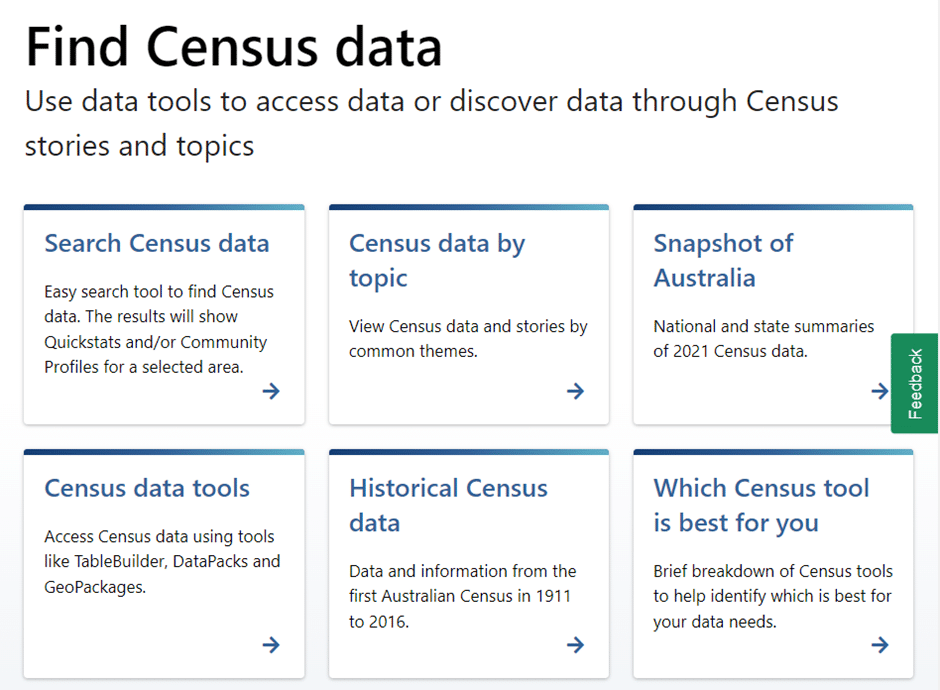
Start at https://www.abs.gov.au/census/find-census-data
To dig into the census information go to Census DataPacks but we suggest NOT going there first.

The DataPacks are all in .CSV (Comma Separate) format that Excel can import easily. Either directly opened or import via Data | Get and Transform data (aka PowerQuery).
But the data is complicated and not easy to read. Here’s just one table as it appears in Excel. 2021Census_G01_AUST_LGA aka Age and Sex by LGA or Local Government Area.

The column headings are understandable. Each Age range has three columns; Male. Female and People (total). That means you can’t just import the data and analyse it because Excel will double-count everyone (first as Male/Female then as People).
The Row titles are the council names or Local Government Area codes. LGA10050 is Albury, NSW. We know that because it’s listed in another sheet included in the download (Metadata/ 2021Census_geog_desc_1st_release.xlsx the Non ABS Structures tab).
Before Downloading
Before downloading a datapack, read the accompanying information. For example this page explains all the different geographical codes.
Also check out the /Metadata folder in the .zip download. The ‘Sequential Template’ and ‘Metadata 2021…’ files explain what each of the G…. .csv data lists contain. For example 2021Census_G05_AUST_LGA.csv is a breakdown of marital status by age and sex per Local Government Area.

After our quick look, we suggest using Excel PowerQuery to import and filter the data before it appears in Excel. That will let you choose the columns to display, perhaps change headings and add names for the LGA or other regional codings.
Once you’ve imported ‘clean’ data, try out Excel 365’s Analyze (formerly Insights) feature to do some fast exploration of the data. To say nothing of PivotTables and PivotCharts.
If all that’s too much, get quick simple look at the 2021 Aussie census check out the Snapshot of Australia.
If the 2021 Census info isn’t enough, there’s data going back to 1911.
Excel’s PowerQuery gets data type conversion options
Faster PivotTables with the new Ideas or Insights feature in Excel