Excel 365 makes it incredibly easy to get past price and volume info for stock, fund and currency exchange data, then convert that into a professional-looking chart.

Some may remember the days when stock prices were added manually from a newspaper. Now a single Excel cell formula can grab the history of thousands of traded entities on exchanges throughout the world.
Once the price data is in place, making a chart is simple in Excel which has chart templates, especially for stock, fund and currency rates.
We’ve covered the basics of StockHistory() the Excel function that can find historical stock price info, but now we’ll go one step further and show you a few ways that you can get even more out of this handy formula.
Stock Charts
Excel can turn your stock data into a chart. Charts really help you to examine current conditions. It’s basically a roadmap to guide you to whether stock prices are trending up or down and is a useful tool for many.
Microsoft provides the usual disclaimer that the financial market information is provided “as-is” and shouldn’t be used for professional or trading purposes or advice. Though you have to wonder if the data can’t be used for those purposes, what use is it? <g>
We’ll show you the main stock charts that are in Excel with examples, which you can find under Insert | Charts.
StockHistory() order is important
The sixth and following parameters in StockHistory() let you choose which data columns to show, usually starting with 0 for the Date column.
The order of those parameters is important to easily make the stock related chart.
We’ve included an example formula for each chart to show the data required and in what order.
High-Low-Close Chart
This’ll arrange the data on your sheet as followed: high price, low price, closing price.
The formula for the below example is:
=STOCKHISTORY("XNAS:AAPL","30/12/2015",TODAY(),2,2,0,3,4,1)

Select the four columns; Date, High, Low and Close then go to Insert | Chart. Excel will suggest some charts based on the selected data. We’re looking for High-Low-Close, if it’s not on the Recommended Charts list, go to the Stock section.

Open-High-Low-Close Chart
The chart adds the opening price to the high price, low price and closing price.
The formula for the below example is:
=STOCKHISTORY("XNAS:AAPL","30/12/2015",TODAY(),2,2,0,2,3,4,1)


Volume-High-Low-Close Chart
The chart shows: volume, high price, low price, closing price.
The formula for the below example is:
=STOCKHISTORY("XNAS:AAPL","30/12/2015",TODAY(),2,2,0,5,3,4,1)


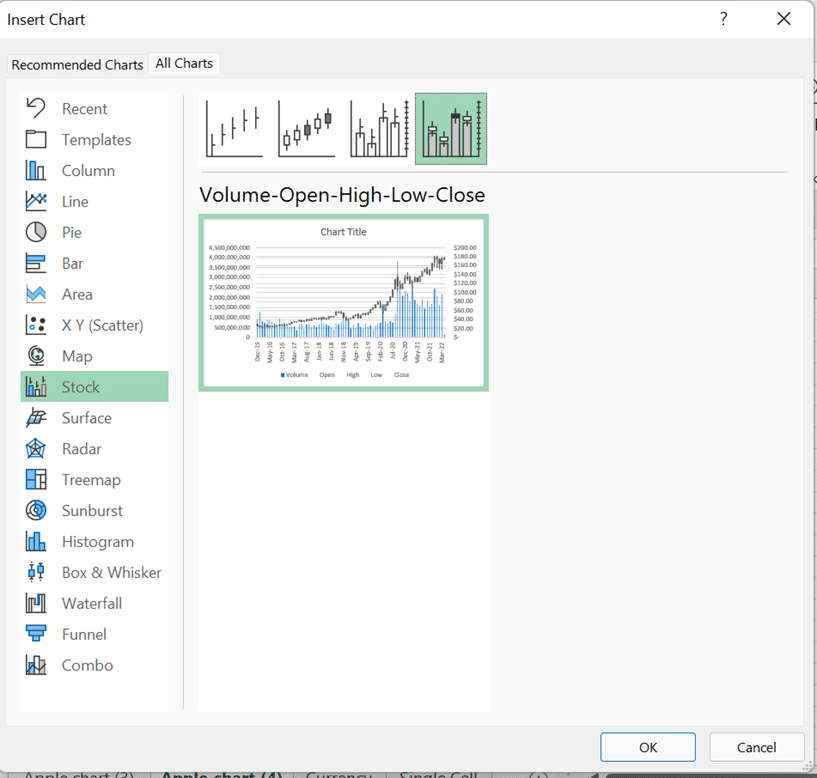
Volume-Open-High-Low-Close Chart
Finally, everything available from StockHistory() in chart form: volume, opening price, high price, low price, closing price.
The formula for the below example is:
=STOCKHISTORY("XNAS:AAPL","30/12/2015",TODAY(),2,2,0,5,2,3,4,1)

The single cell trick to get an Excel stock or currency rate
Quick stock price analysis and charts with Excel StockHistory()
Excel’s Stock / Currency data (kinda, sorta) gets auto-refresh