Excel PivotTable can show a count of unique items if you know where to look. Handy to see the number of customers, products or students from a long data list.
What is the count of unique customers who made purchases in each region?
How many unique products were sold in each store?
How many different salespeople sold each product within each region?
Let’s look at a simple example of how to count unique item from the sample Pivot Table :
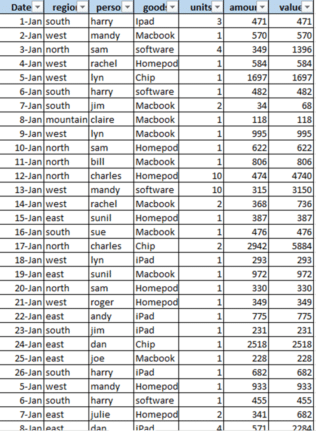
The sample Pivot spreadsheet displays details such as Dates, Region, Person, Goods, units sold, amount and values. Like a lot of data lists it has a lot of duplicate items (region, person, product).
We’ve quickly made into a PivotTable which count the ‘Person’ column but it includes duplicates. In other words, it shows there are 17 ‘people’ in the East region but that’s really just the number of rows.
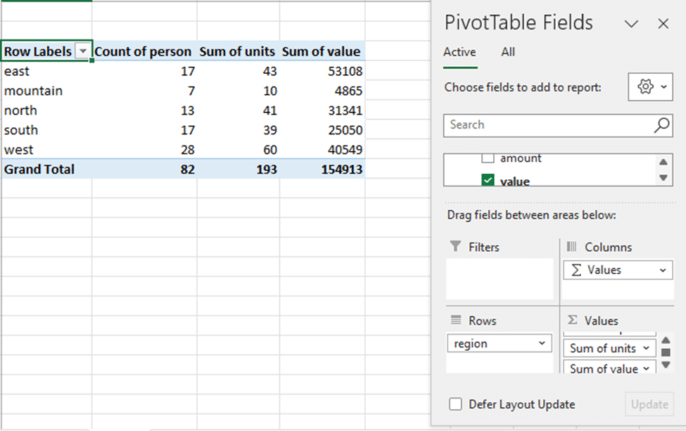
Since the Person field contains text, it automatically defaults to displaying the Count of Person. The count indicates the total number of transactions within each region, not the number of individual customers.
Distinct Count
To get a unique count of salespersons in each region, you need to change ‘Count’ to ‘Distinct Count’.
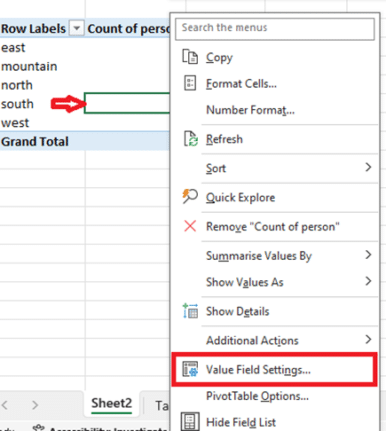
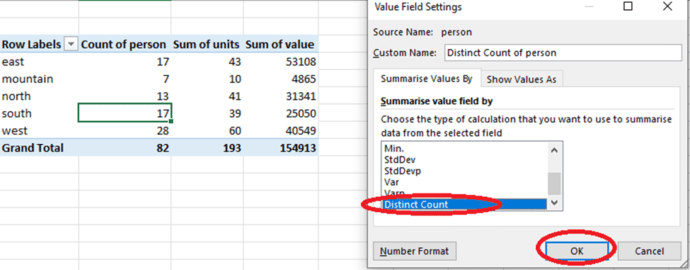
Right-click on any of the values listed under the “Person” field, then select “Value Field Settings” from the pop-up menu.
From the Value Field Settings window, navigate to the “Summarize Values By” tab. Here, you’ll find a list of calculation types. By default, “Count” is preselected since the field currently uses this calculation method.
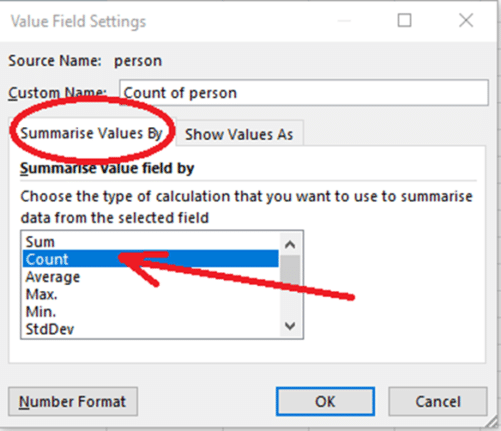
You can easily change the calculation type by scrolling to the bottom of the list. Select the Distinct Count calculation type and Click OK to apply the change and close the dialog box.
After you click the OK button, the Salesperson field in the pivot table changes automatically.
Now, instead of showing the total count of Person, it shows a distinct count of Person, for each region. It does not count duplicate values.
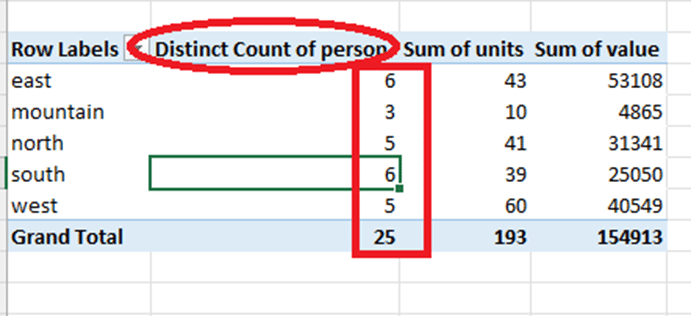
In other words, how many individual customers there are in each region and overall.
Pivotby – Excel’s new faster PivotTables
Add pictures to your Excel PivotTables
Smarter PivotTable recommendations coming to Excel
How to Filter Data in a PivotTable