Calculating the ‘Standard Error of the mean’ or SEM is simple using Excel’s in-built functions. Understanding ‘Standard Error of the mean’ isn’t hard either. We’ll explain the formula and what it all means.
To calculate standard error of the mean get the Standard Deviation of a sample (STDEV.S() or STDEV()) then divide by the square root of the count.
= STDEV.S(<first cell in the range>:<last cell in the range>) /
  SQRT(COUNT(<first cell in the range>:<last cell in the range>))
For example, the formula to find the standard deviation based on the sample (range of cells from A1 to E5) the formula would become as followed:
=STDEV.S(A1:E5)/SQRT(COUNT(A1:E5))

Understand ‘Standard Error of the mean’
The ‘Standard Error of the mean’ measures how far the sample mean of the data is likely to be compared to the population mean.
See Population vs Sample with Standard Deviation in Excel.
It’s not a hard value because we don’t know all the data from the entire group (population). It’s a probable or estimate of the difference between the sample mean and the full list mean.
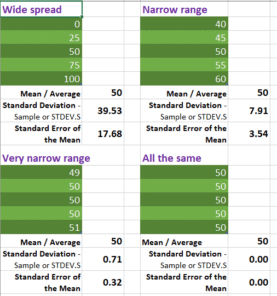
Here’s four examples with just five numbers all averaging 50, one group is widely spread out but others are nearly the same.

Just like Standard Deviation, Standard Error of the Mean approaches Zero as the sample becomes more uniform.
Standard Deviation is easy to use and understand in Excel
Coronavirus global statistics, Excel workbook update
Easily compare a series of values with ChiTest() Excel
Using Benford’s Law magic with Excel