A friend of Office Watch has enhanced our latest COVID-19 global statistics workbook and offered to share it with all our readers
Phil Y from Sydney is interested in the number of active Coronavirus cases and how many new cases. That data was in the external connection so he made a different worksheet with the columns and calculations he wanted.
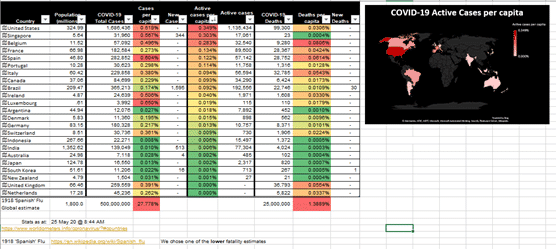
New Cases – the number of new Coronavirus cases. As you can see, the reporting of this statistic is spotty at best.
Active Cases – how many known Coronavirus cases
Per capita – the raw numbers often quoted in the press don’t make a lot of sense unless compared a country’s population. The Per Capita (per person) let you compare how countries are faring.
Download COVID-19 Global Statistics workbook there’s also a limited Excel 365 for Mac version.
The full workbook requires a recent Excel 365 for Windows — only Excel 365’s updated in the last few months have all the features necessary (especially Get & Transform, Geography Date Types and Map Charts).
There’s now an extra worksheet / tab available: Cases – Active and New as well as the original COVID-19 cases tab.
Refresh All data connections
Refresh the Coronavirus data from Data | Refresh All. A recalculation (F9 or Formulas | Calculation | Calculate now) does not update data connections. The last update time is shown at the bottom of the table. That’s something done with a little hack of PowerQuery since, astonishingly, it’s not available directly in Excel.
Update Table Sorting
Even then, the sorting of the table is not updated which means the conditional formatting might be out of order. Automatically resorting would require some VBA code (amazingly) and a change of workbook type which might concern some people (rightly).

After updating the data connections, the colors/sorting might not be correct. Fix that by choosing the pull-down next to either ‘per capita’ column and choose ‘Sort Largest to Smallest’ again – that will force Excel to resort and recolor the table.
Handle with care
We’ve added more countries to show some anomalies and demonstrate how these COVID-19 stats have to be treated with care.
- The Coronavirus statistics are counted in different ways in each country. Some count only those who has tested postive for virus before death, others includes people who have matching symptoms but no confirming test. There are many cases were COVID-19 is a contributing factor which may, or may not, be listed on the death certificate.
- Some countries don’t have comprehensive system of mortality reporting. People can often die without any doctor attending or certifying cause of death. At the moment, countries like the UK are allowing doctors to certify death ‘over the phone’ for cases attended by nurses in care homes.
- Other countries have a government trying to understate the problem.
- San Marino and Andorra are tiny countries in Europe (think Freedonia or Grand Duchy of Fenwick.
- Belgium is a mystery since they’ve taken similar measures to surrounding countries. The high rates could be caused by more accurate reporting rather than a truly worse spread of the disease.
Statistical experts are regularly warning about using these numbers to make firm pronouncements. This is an ongoing situation with varying quality of statistics. It’s clear that some countries (UK, France, Italy) are suffering worse that similar places (Germany, Denmark, Canada). Australia and especially New Zealand have benefited from their remote location and fast, firm action from their governments.
But it’s way too early to make firm statements about how each country has fared based on the numbers coming in on a daily basis.
Track COVID-19 stats in your own Excel spreadsheet
COVID-19 stats in Excel 365 for Mac
Get your COVID-19 tracking app
Windows and Office are handling COVID-19 very differently
COVID-19 Excel workbook – under the hood