Here’s two ways to make a running total column in Excel. The way you were probably taught and a much better and more flexible choice.
Running or Accumulative Totals are a very common thing in spreadsheets. Here’s a really simple example in columns C and E.
Here’s two ways to make those totals, using Sum() or the more powerful PivotTable way.
Running Total with SUM()
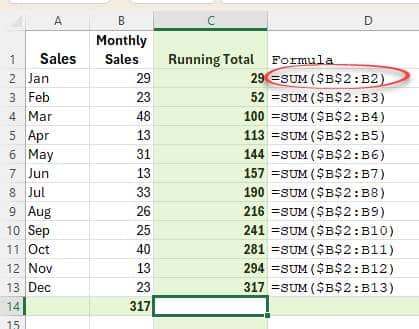
The standard “Excel 101” method to make a running total is the SUM() function.
In the first cell make a formula like this =Sum($B$2:B2)
The first cell to total is fixed, using the $ symbol $B$2
The second cell, to end the range, isn’t fixed and starts with the first cell – B2
Copy that formula down the column and the second cell reference changes but not the first – giving a running total of the cells to that point (row).
All very simple and straight out of any spreadsheet workbook back to the first Excel or even Visicalc.
Better running totals with PivotTables
The more flexible option is to use a PivotTable. Start by making a PivotTable (Insert tab) that looks like the original data.
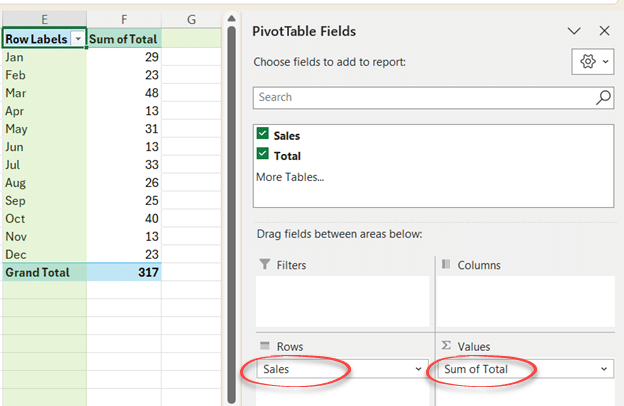
Next add a second ‘Sum of Total’ column under Values and rename it for clarity.
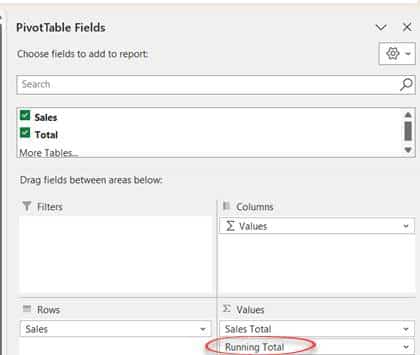
So now you have two columns showing the same information – until you add the PivotTable magic. Right-click in the Running Total cell and choose “Show Values As …” then “Running Total in …”
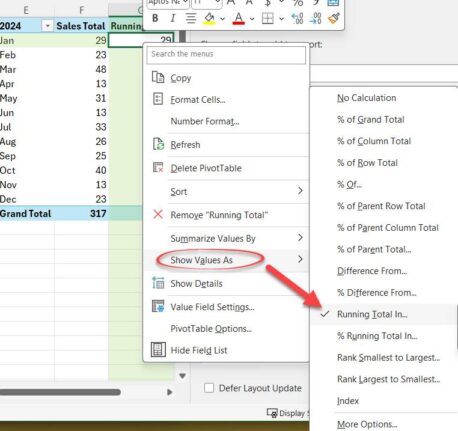
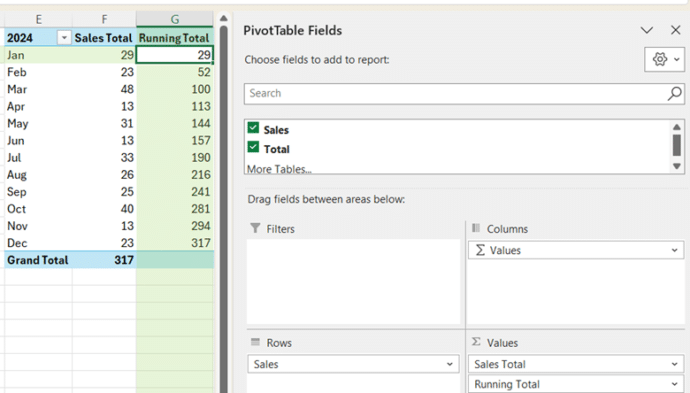
Now you have a running total column.
That might seem like a long way to do the same thing until you look at the “Show Values As …” menu (above) and see what’s possible.
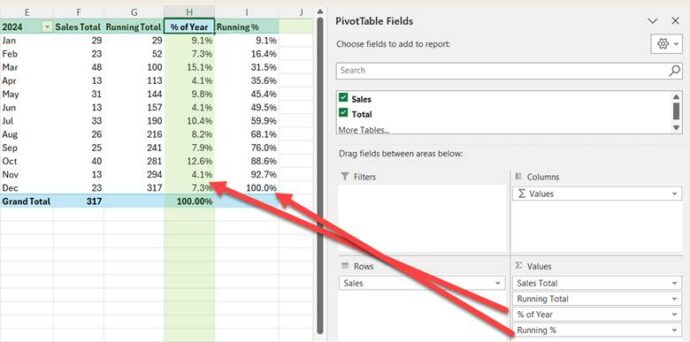
% of Parent Row Total – shown above as “% of Year” lets you immediately see which months have the best sales.
% Running total in – shown above as “Running %” accumulates the % until it reaches 100%.
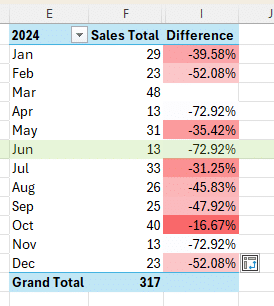
Difference From …
The possibilities are almost endless, here’s just one more, the ‘Difference from ‘ options:
- Difference From
- % Difference From
Now you can see the change from another value, like the previous month.
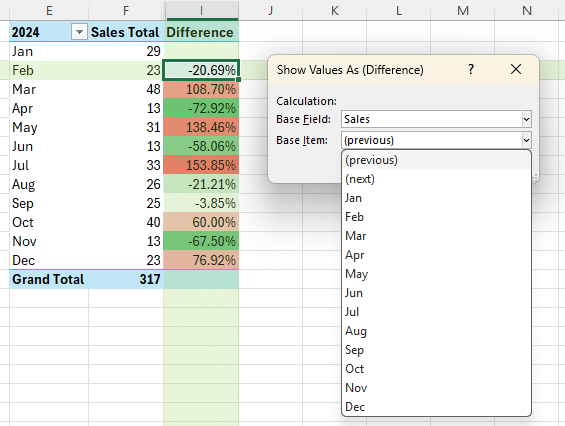
(we added Conditional Formatting, because we can’t help ourselves).
The ‘Previous’ option is probably the most common but you could choose another, for example to compare with a single month (perhaps the best or worse performing month). Here’s ‘% Difference from … March” the highest value in the series.